
How Homicide Rates Have Changed Since 2012 By US State
Share
Are the United States getting more dangerous or more safe? The answer partially depends on your metric of choice.
For example, by examining homicide rates by state from 2012 to 2022, it can be seen that rates have increased almost across the board. That said, they are still lower than rates seen in the 1980s and 1990s.
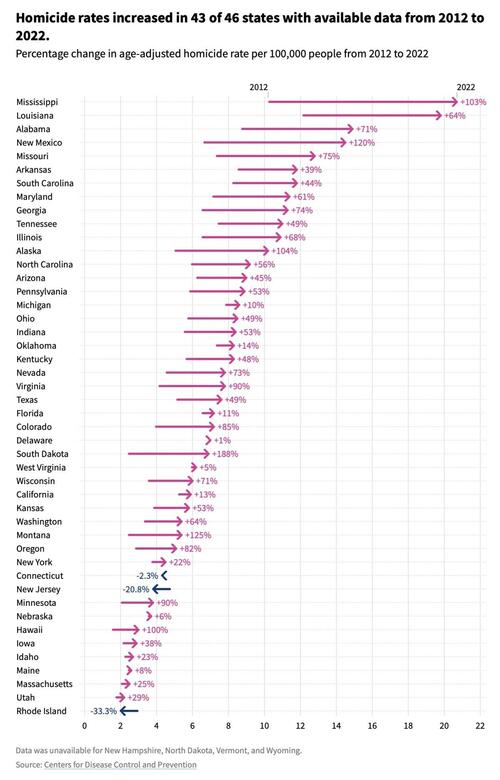
This graphic, via Visual Capitalist, from USAFacts examines the age-adjusted homicide rates by state from 2012 to 2022, and how they’ve changed. It uses CDC data available for 46 states, with no data available for New Hampshire, North Dakota, Vermont, and Wyoming.

Comparing States by Homicide Rates
From 2012 to 2022, homicide rates increased in every state with available data except for Connecticut, New Jersey, and Rhode Island. Here are the rates for all 46 available states as well as their 10-year change in percentage:
State Homicide rate
(2022, age-adjusted per 100,000) 10-Year Change
(2012–2022) Mississippi 20.7 +103% Louisiana 19.8 +64% Alabama 14.9 +71% New Mexico 14.5 +120% Missouri 12.8 +75% Arkansas 11.8 +39% South Carolina 11.8 +44% Maryland 11.4 +61% Georgia 11.3 +74% Tennessee 11.0 +49% Illinois 10.9 +68% Alaska 10.2 +104% North Carolina 9.2 +56% Arizona 9.0 +45% Pennsylvania 8.9 +53% Michigan 8.6 +10% Ohio 8.5 +49% Indiana 8.4 +53% Kentucky 8.3 +48% Oklahoma 8.3 +14% Nevada 7.8 +73% Virginia 7.8 +90% Texas 7.6 +49% Colorado 7.2 +85% Florida 7.2 +11% Delaware 7.0 +1% South Dakota 6.9 +188% West Virginia 6.2 +5% Wisconsin 6.0 +71% California 5.9 +13% Kansas 5.8 +53% Montana 5.4 +125% Washington 5.4 +64% Oregon 5.1 +82% New York 4.5 +22% Connecticut 4.3 -2.3% Minnesota 3.8 +90% New Jersey 3.8 -20.8% Nebraska 3.7 +6% Hawaii 3.0 +100% Iowa 2.9 +38%


